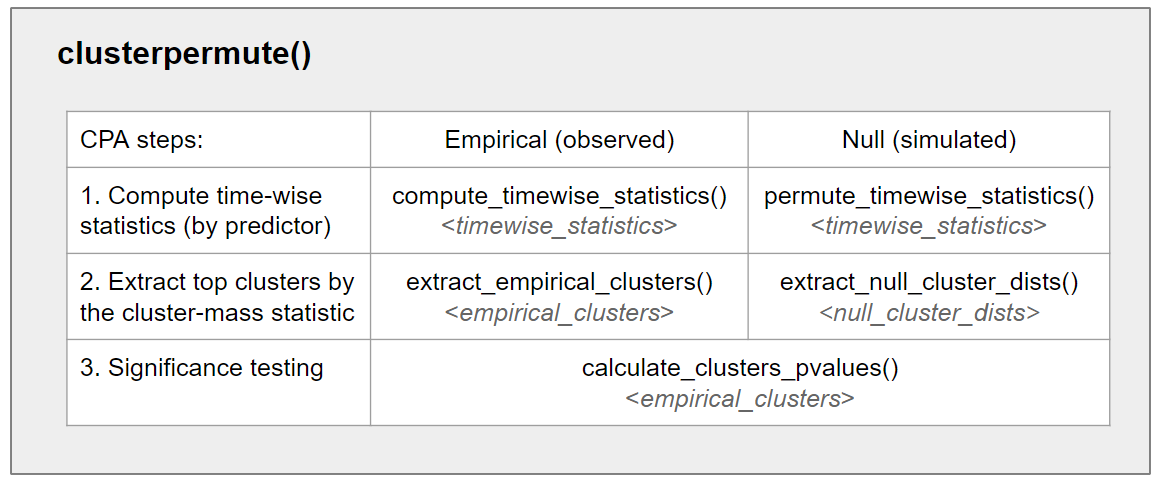
jlmerclusterperm is an interface to regression-based
CPAs which supports both wholesale and piecemeal approaches to
conducting the test.
Overview of CPA
Cluster-based permutation analysis (CPA) is a simulation-based, non-parametric statistical test of difference between groups in a time series. It is suitable for analyzing densely-sampled time data (such as in EEG and eye-tracking research) where the research hypothesis is often specified up to the existence of an effect (e.g., as predicted by higher-order cognitive mechanisms) but agnostic to the temporal details of the effect (such as the precise moment of its emergence).
CPA formalizes two intuitions about what it means for there to be a difference between groups:
The countable unit of difference (i.e., a cluster) is a contiguous, uninterrupted span of sufficiently large differences at each time point (determined via a threshold).
The degree of extremity of a cluster (i.e., the cluster-mass statistic) is a measure that is sensitive to the magnitude of the difference, its variability, and the sample size (e.g., the t-statistic from a regression).
The CPA procedure identifies empirical clusters in a time series data and tests the significance of the observed cluster-mass statistics against bootstrapped permutations of the data. The bootstrapping procedure samples from the “null” (via random shuffling of condition labels), yielding a distribution of cluster-mass statistics emerging from chance. The statistical significance of a cluster is the probability of observing a cluster-mass statistic as extreme as the cluster’s against the simulated null distribution.
Package design

jlmerclusterperm provides both a wholesale and a
piecemeal approach to conducting a CPA. The main workhorse function in
the package is clusterpermute(), which is composed of five
smaller functions that are called internally in succession. The smaller
functions representing the algorithmic steps of a CPA are also exported,
to allow more control over the procedure (e.g., for debugging and
diagnosing a CPA run).
See the function documentation for more.
Organization of vignettes
The package vignettes are roughly divided into two groups: topics and case studies. If you are a researcher with data ready for analysis, it is recommended to go through the case studies first and pluck out the relevant bits for your own desired analysis
In the order of increasing complexity, the case studies are:
Garrison et al. 2020, which introduces the package’s functions for running a CPA, demonstrating both wholesale and piecemeal approaches. It also compares the use of linear vs. logistic regression for the calculation of timewise statistics.
Geller et al. 2020, which demonstrates the use of random effects and regression contrasts in the CPA specification. It also compares the use of t vs. chisq timewise statistics.
de Carvalho et al. 2021, which showcases using custom regression contrasts to test the relationship between multiple levels of a factor. It also discusses issues surrounding the complexity of the timewise regression model.
Ito et al. 2018, which presents a visual guide on the interpretation of results when a CPA involves multiple predictors and their interactions. It especially focuses on the interpretation of interaction terms and their special nature in a CPA.
The topics cover general package features:
Tidying output:
tidy()and other ways of collectingjlmerclusterpermobjects as tidy data.Julia interface: interacting with Julia objects using the JuliaConnectoR package.
Reproducibility: using the Julia RNG to make CPA runs reproducible.
Asynchronous CPA: running a CPA in a background process using the future package.
Comparison to eyetrackingR: Translating eyetrackingR code for CPA with
jlmerclusterperm.
Compared to other implementations
There are other R packages for cluster-based permutation analysis, such as clusterperm, eyetrackingR, permuco, and permutes.
Compared to existing implementations, jlmerclusterperm
is designed to be maximally faithful to (ex: no approximations) and
optimized for (ex: multi-threading) CPAs based on mixed-effects
regression models, suitable for typical experimental research
data with multiple, crossed grouping structures (e.g., subjects and
items). It is also the only package with a modular interface to all the
individual algorithmic steps of a CPA.
Further readings
The original method paper for CPA by Maris & Oostenveld 2007 and a more recent overview paper by Meyer et al. 2021 (on CPA for EEG research, but applies more broadly)
A critical paper Sassenhagen & Draschkow 2019 on the DOs and DON’Ts of of interpreting and reporting CPA results.
A review paper on eyetracking analysis methods Ito & Knoeferle 2023 which compares CPA to other statistical techniques for testing difference between groups in time series data.
The JOSS paper for the permuco package (Frossard & Renaud 2021) and references therein.
Benedikt V. Ehinger’s blog post, which includes a detailed graphical explainer for the CPA procedure.
