Blog Posts

2025 Year in Review
In 2025, I finished my PhD, got a job, and moved to New York.

Read files on the web into R
For the download-button-averse of us

Naming patterns for boolean enums
Some thoughts on the principle of enumerating possible options, even for booleans
`ave()` for the average {dplyr} user
tidyverse 🤝 base R
args(args(args)(args))
The unexpected sequal to "R is a language optimized for meme-ing"
HelloWorld("print")
R is a language optimized for meme-ing

2023 Year in Review
Reflections and updates on what I've been up to in 2023
The many ways to (un)tidy-select
Deconstructing {tidyselect} and building it back up

Fumbling my way through an XY problem
Some lessons learned from a (personal) case study
Row relational operations with slice()
A love letter to dplyr::slice() and a gallery of usecases

First impressions of DataFrames.jl and accessories
Perspectives from a {dplyr} and {data.table} useR

Reflections on useR! 2022
Notes from attending and speaking at my first R conference
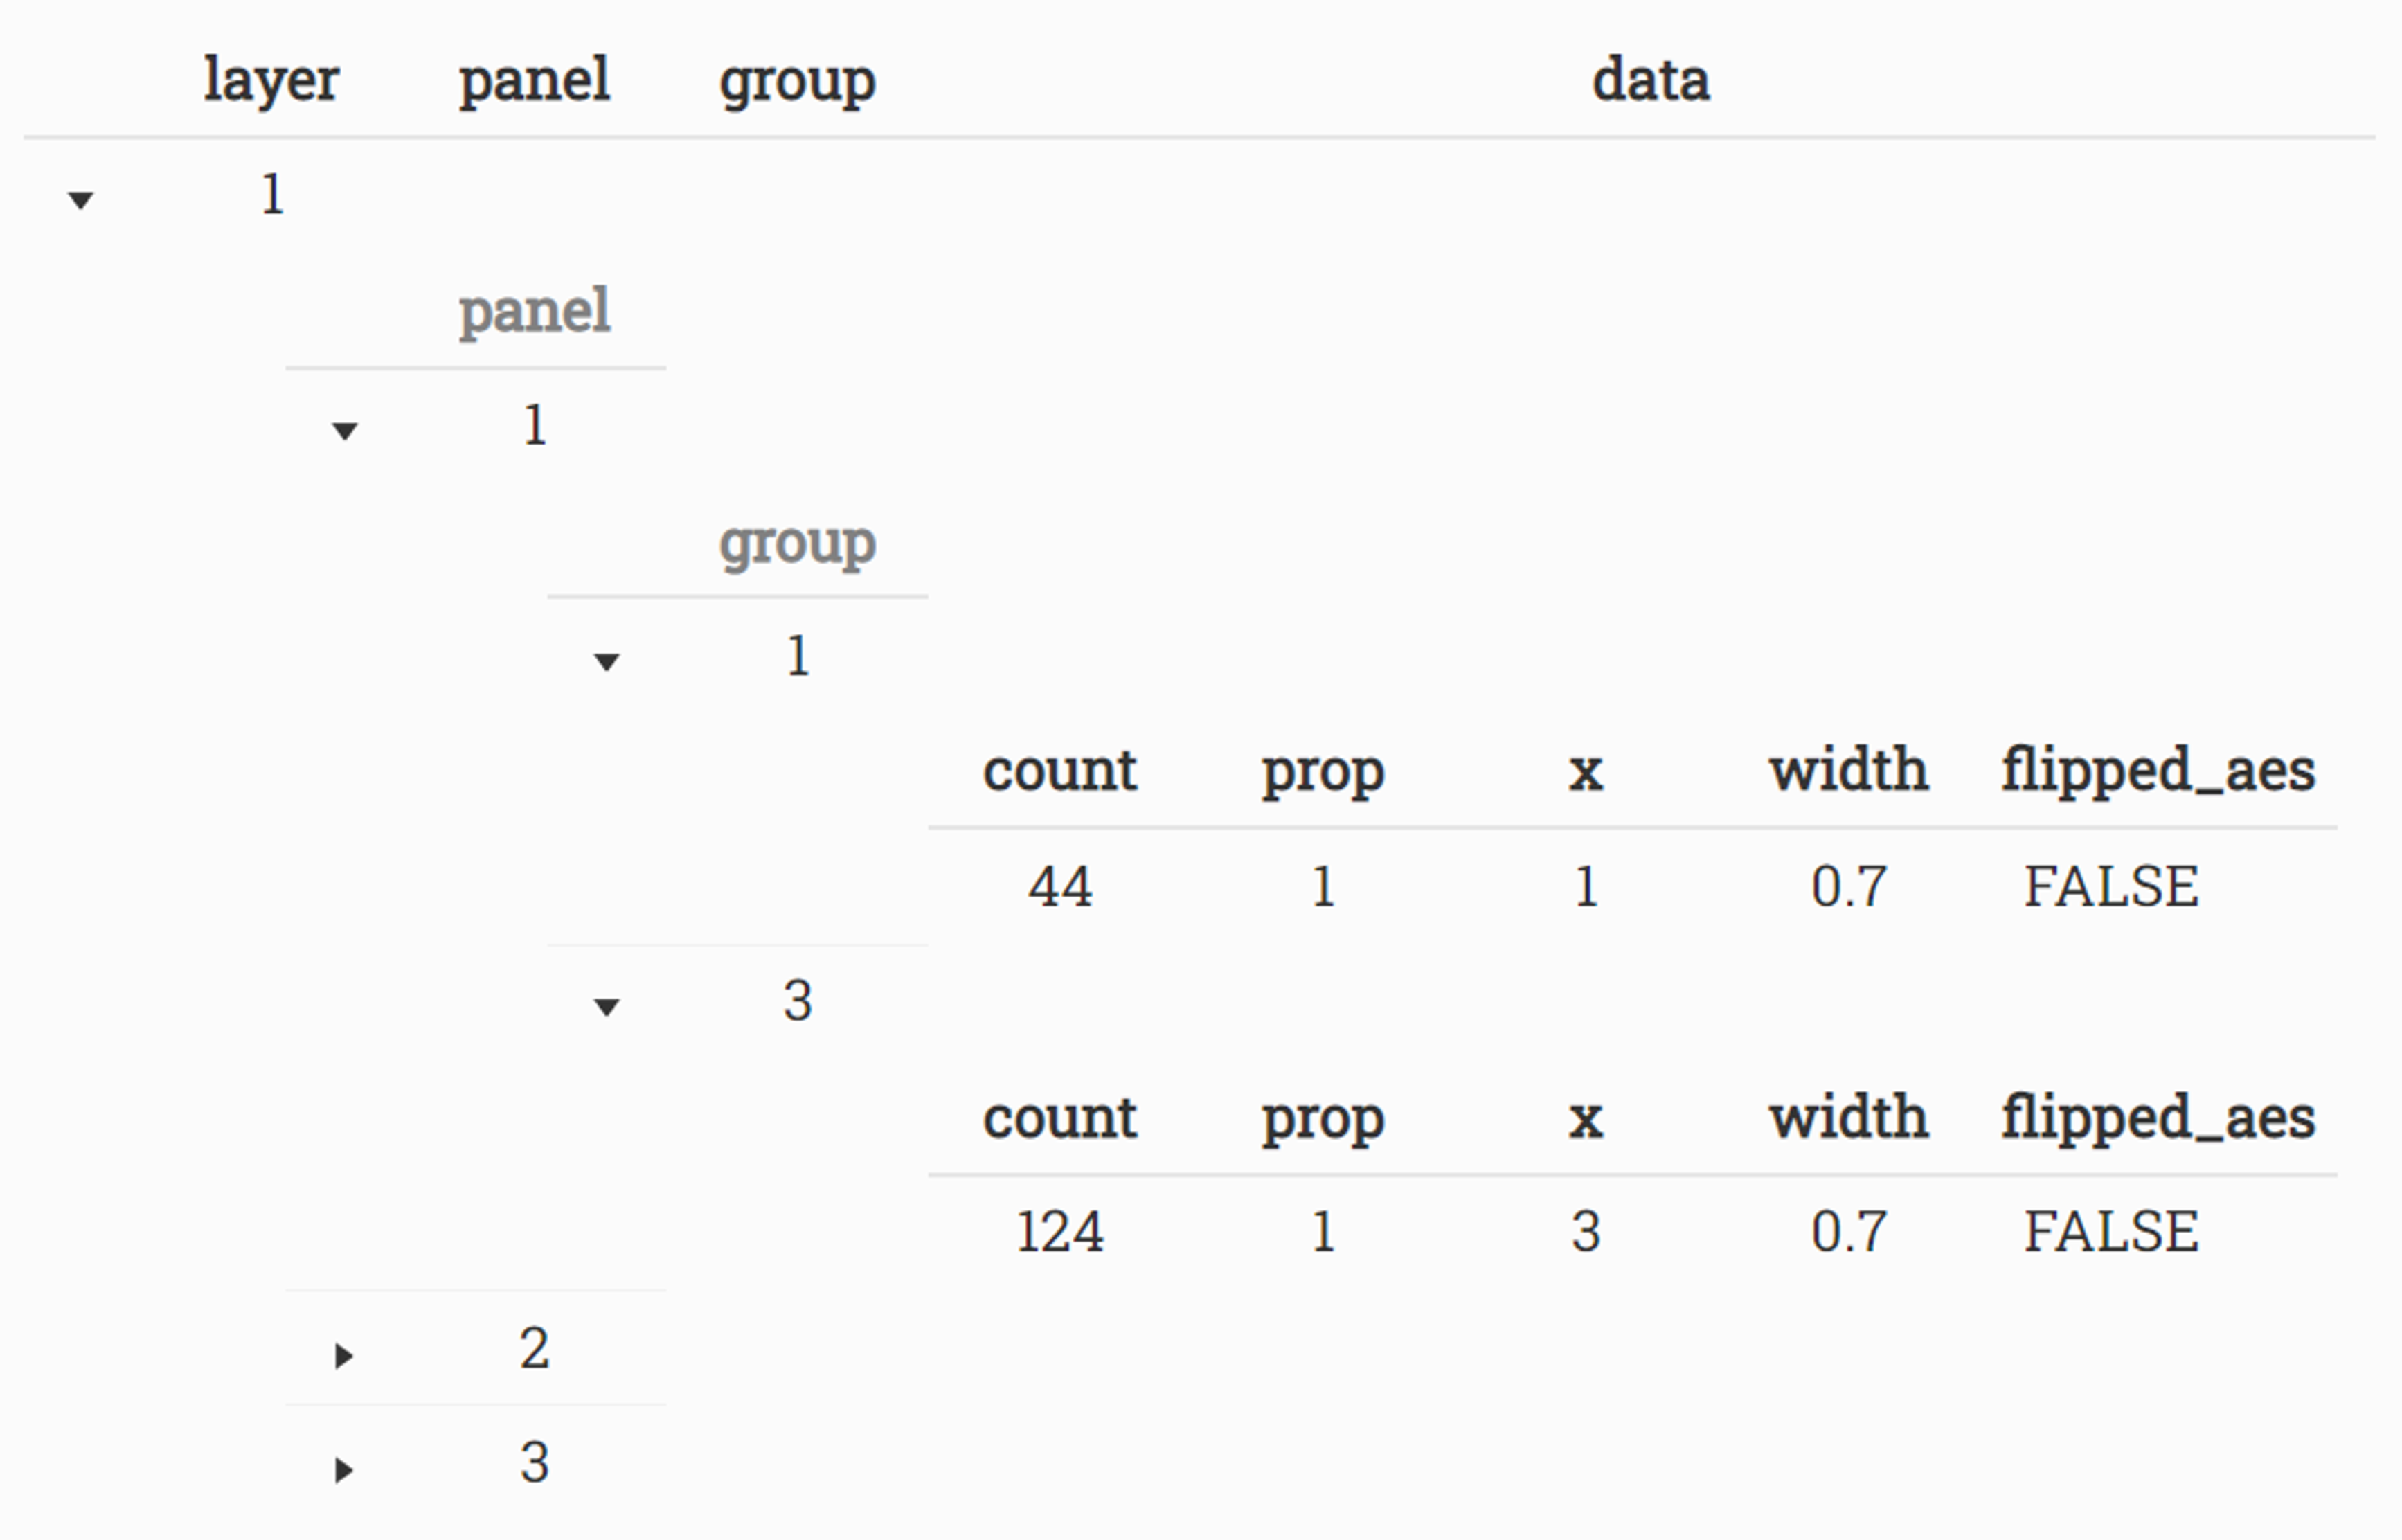
Demystifying delayed aesthetic evaluation: Part 2
Exposing the `Stat` ggproto in functional programming terms
Demystifying delayed aesthetic evaluation: Part 1
Exploring the logic of `after_stat()` to peek inside ggplot internals
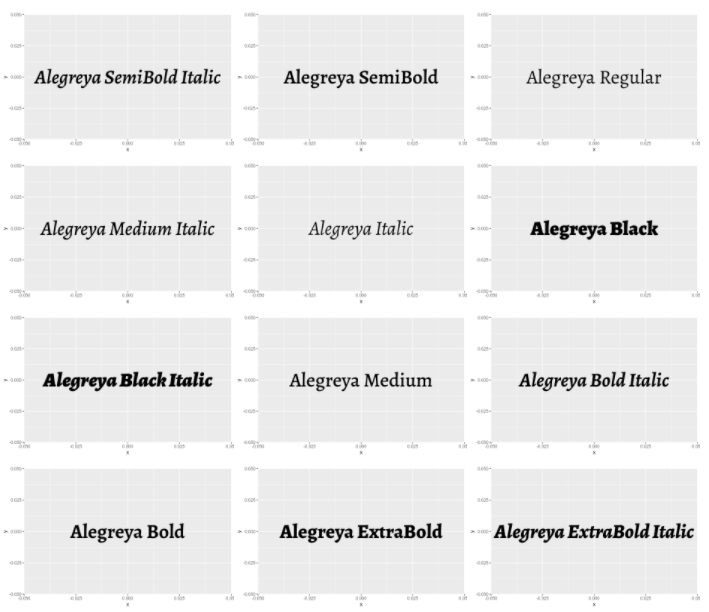
Setting up and debugging custom fonts
A practical introduction to all (new) things font in R
Random Sampling: A table animation
Plus a convenient way of rendering LaTeX expressions as images
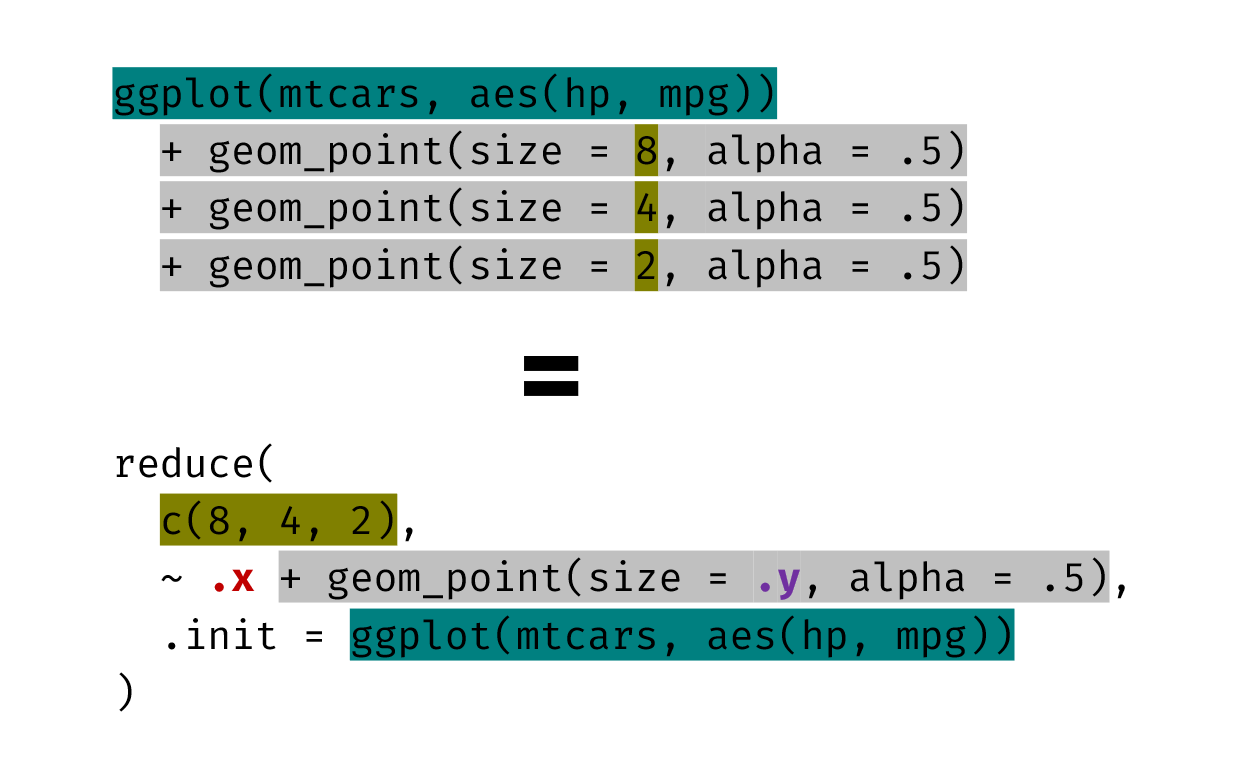
Collapse repetitive piping with reduce()
Featuring accumulate()
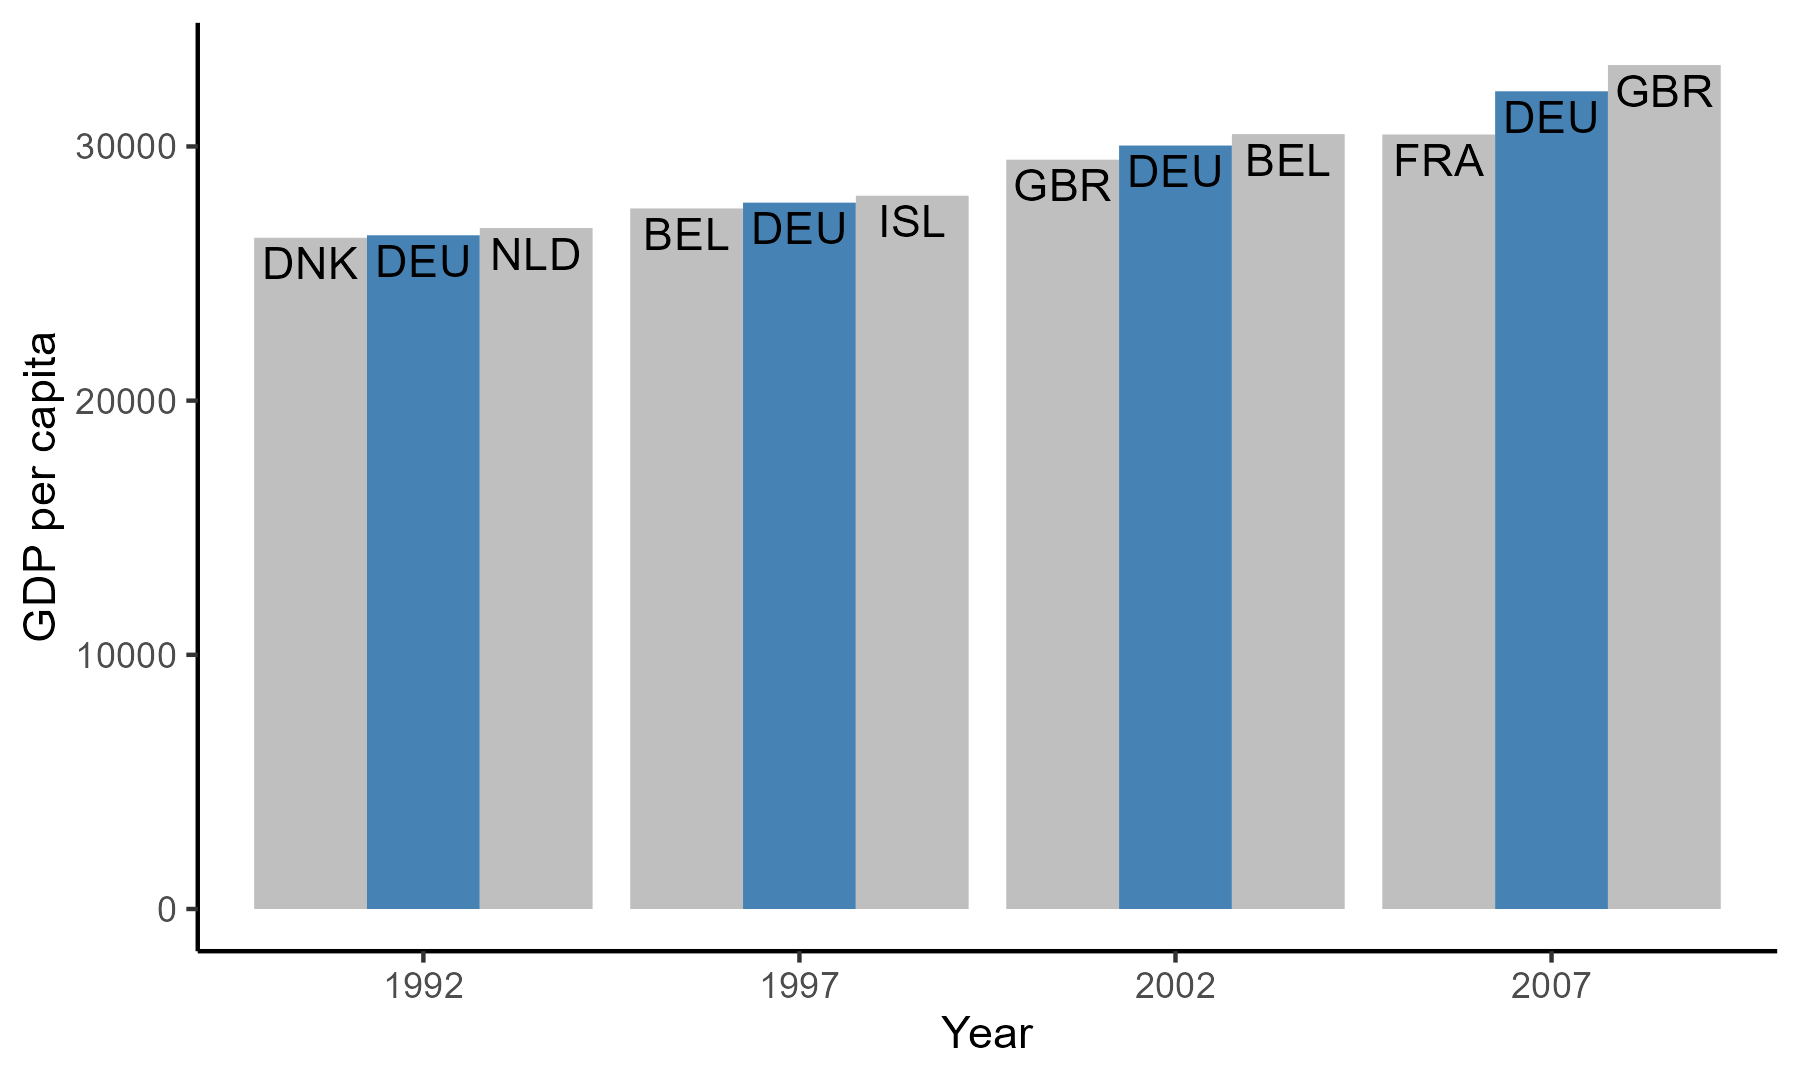
Plot Makeover #2
Making a dodged-stacked hybrid bar plot in {ggplot2}
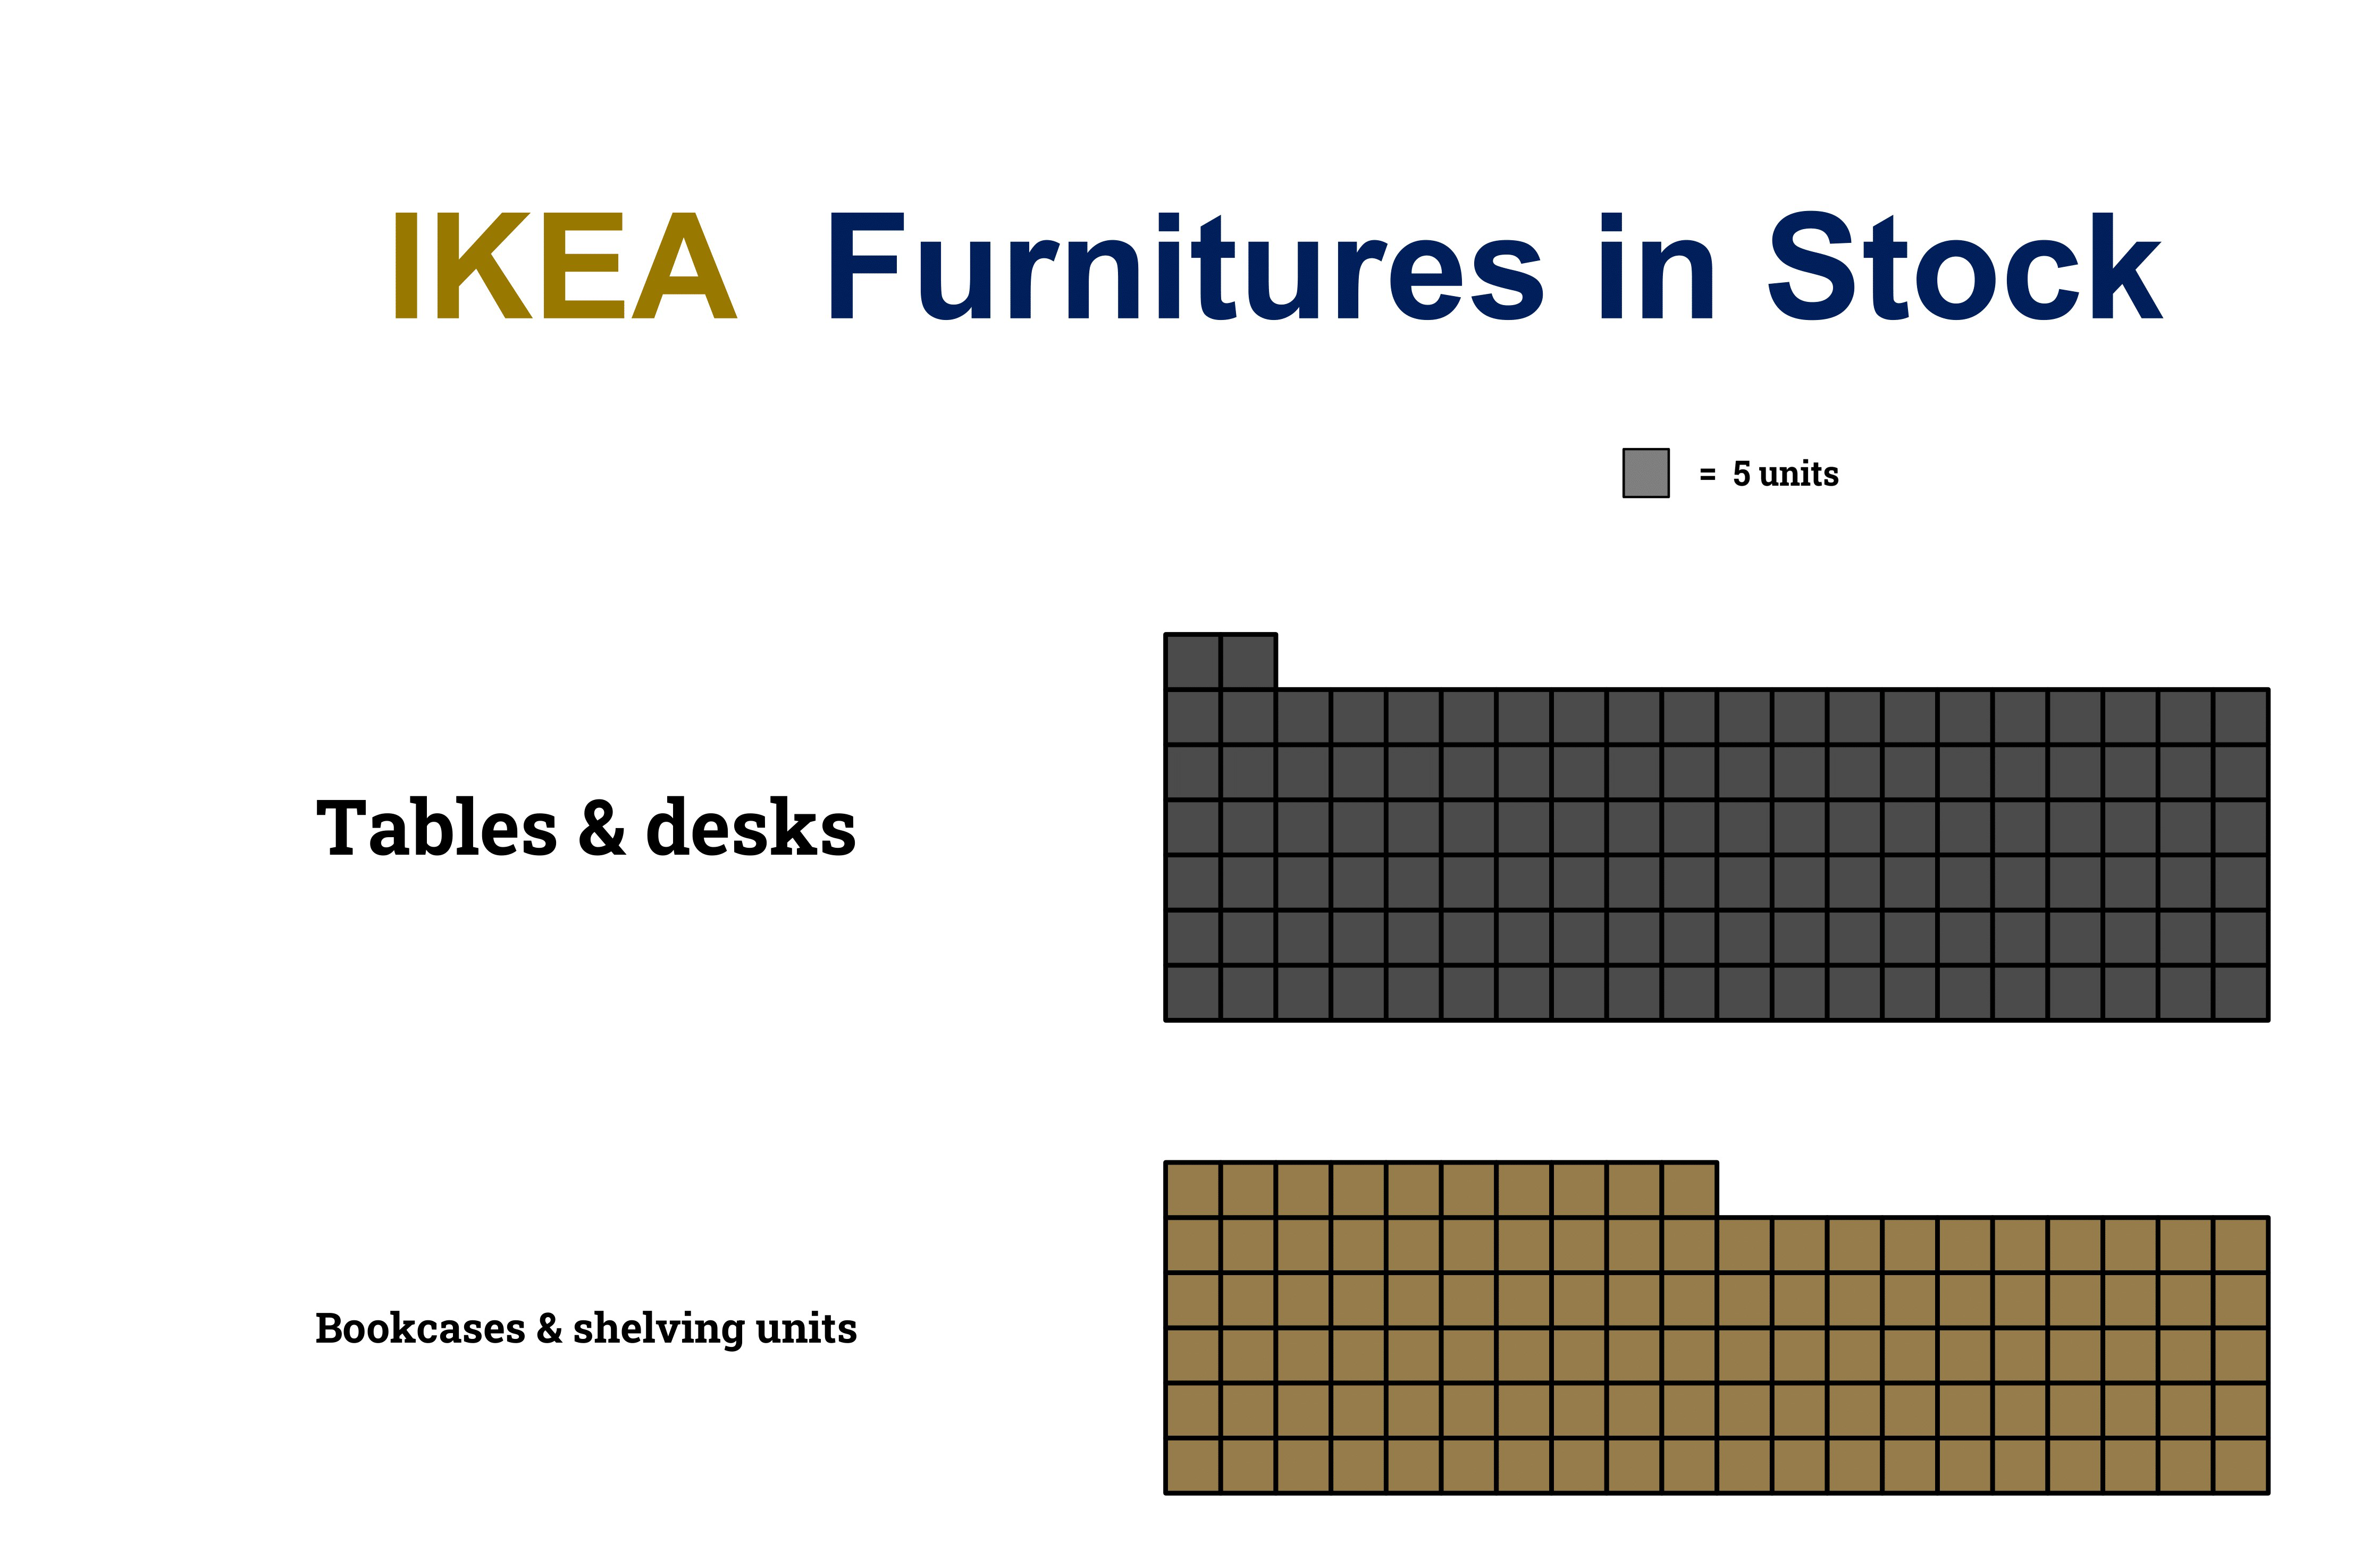
TidyTuesday 2020 week 45
Waffle chart of IKEA furnitures in stock

TidyTuesday 2020 week 44
Patched animation of the location and cumulative capacity of wind turbines in Canada

Analysis of @everycolorbot's tweets
And why you should avoid neon colors
Designing guiding aesthetics
The fine line between creativity and noise

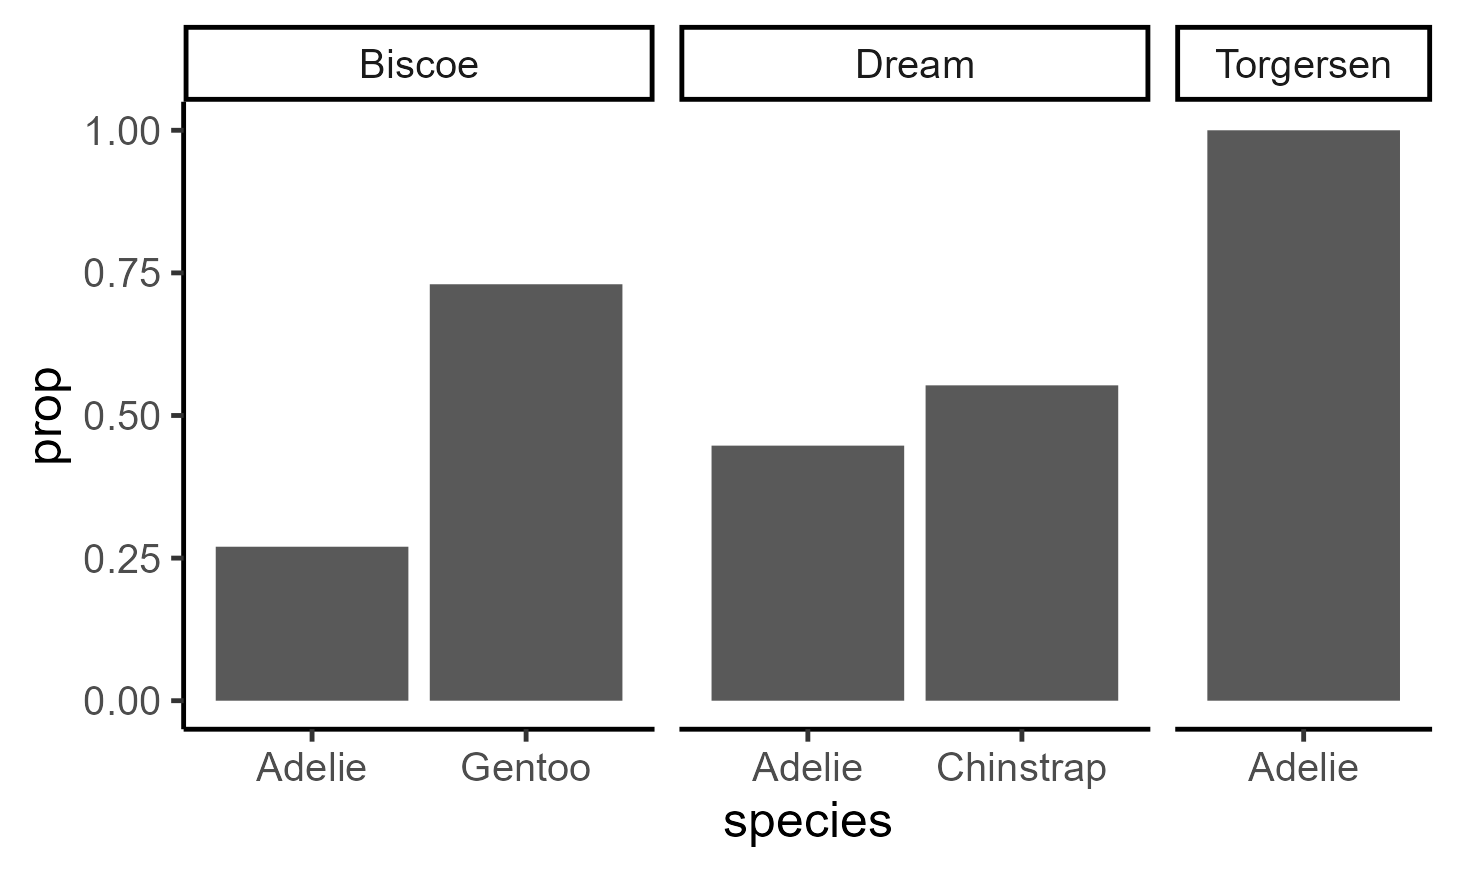
Demystifying stat_ layers in {ggplot2}
The motivation behind stat, the distinction between stat and geom, and a case study of stat_summary()
TidyTuesday 2020 week 39
Stacked area plot of the heights of Himalayan peaks attempted over the last century
Plot Makeover #1
Flattening a faceted grid for strictly horizontal comparisons
TidyTuesday 2020 week 38
Visualizing two decades of primary and secondary education spending with {gt}

Embedding videos in {reactable} tables
Pushing the limits of expandable row details
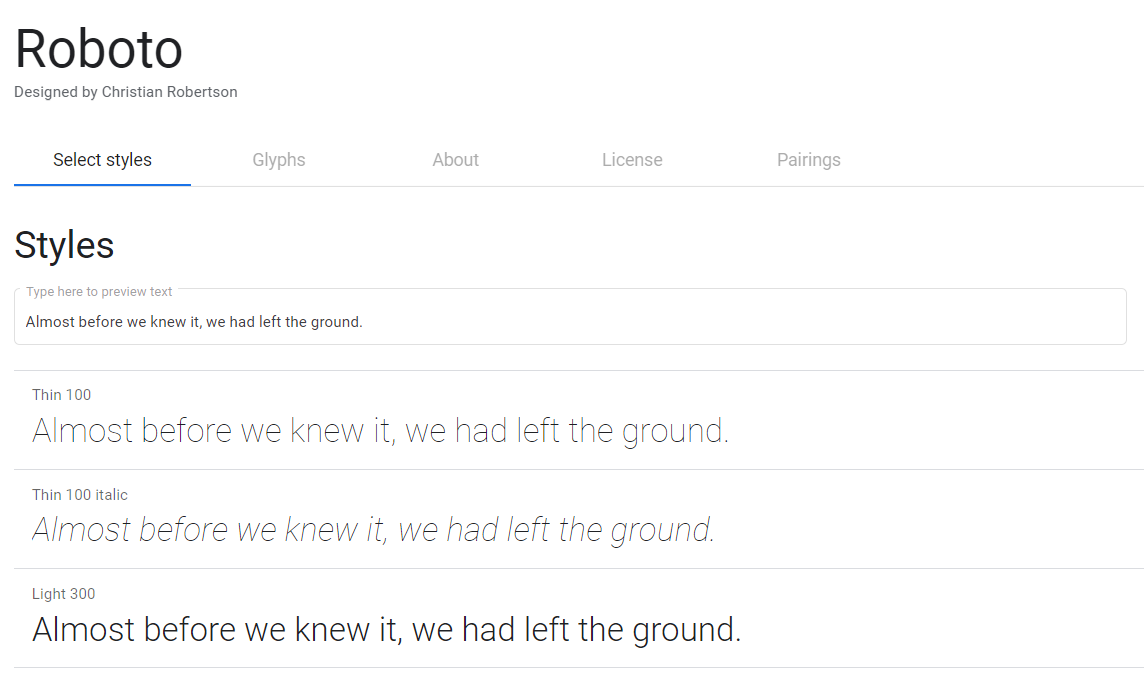
Fonts for graphs
A small collection of my favorite fonts for data visualization

TidyTuesday 2020 Week 33
An animation of the main characters in Avatar

Saving a line of piping
Some notes on lesser known functions/functionalities that combine common chain of {dplyr} verbs.
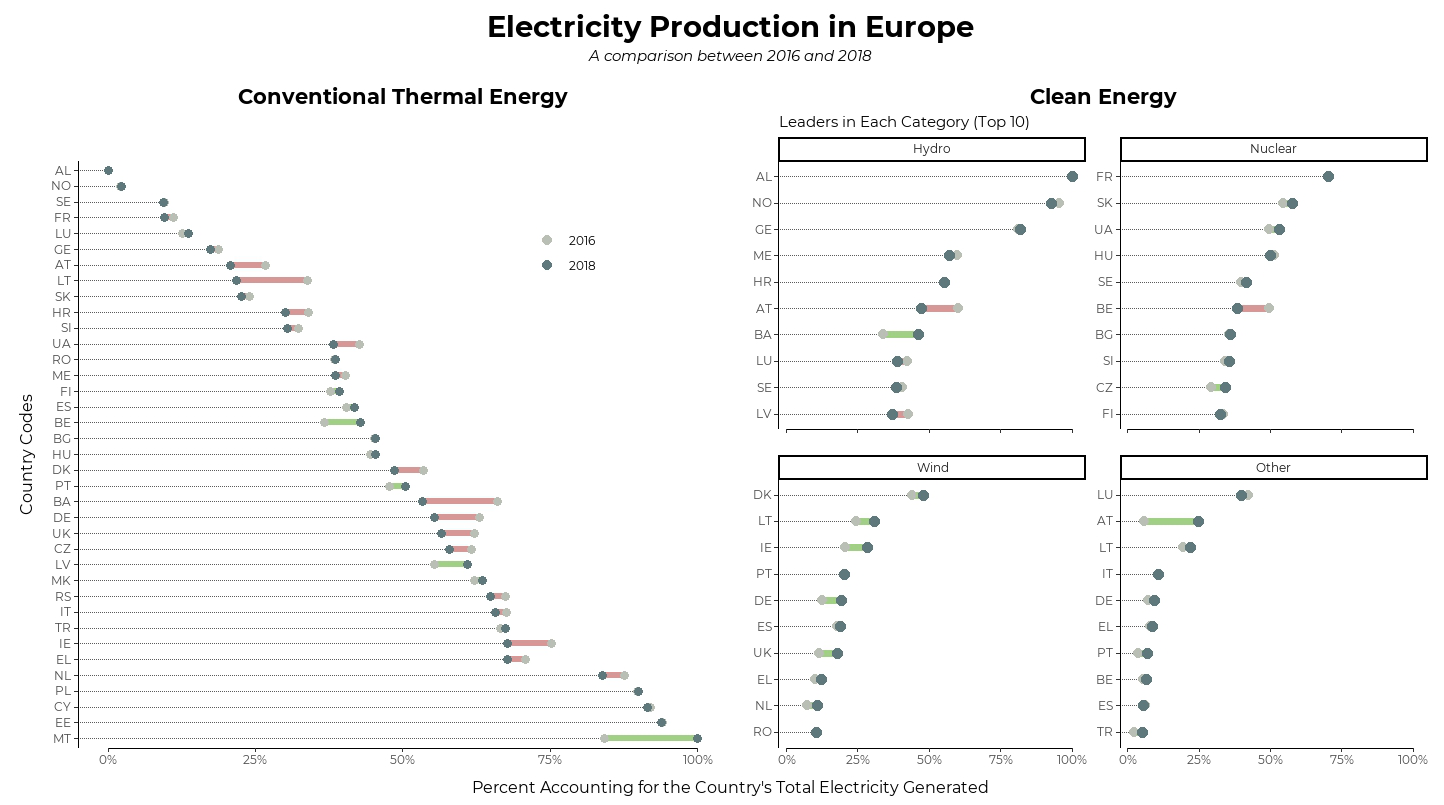
TidyTuesday 2020 Week 32
A dumbbell chart visualization of energy production trends among European countries
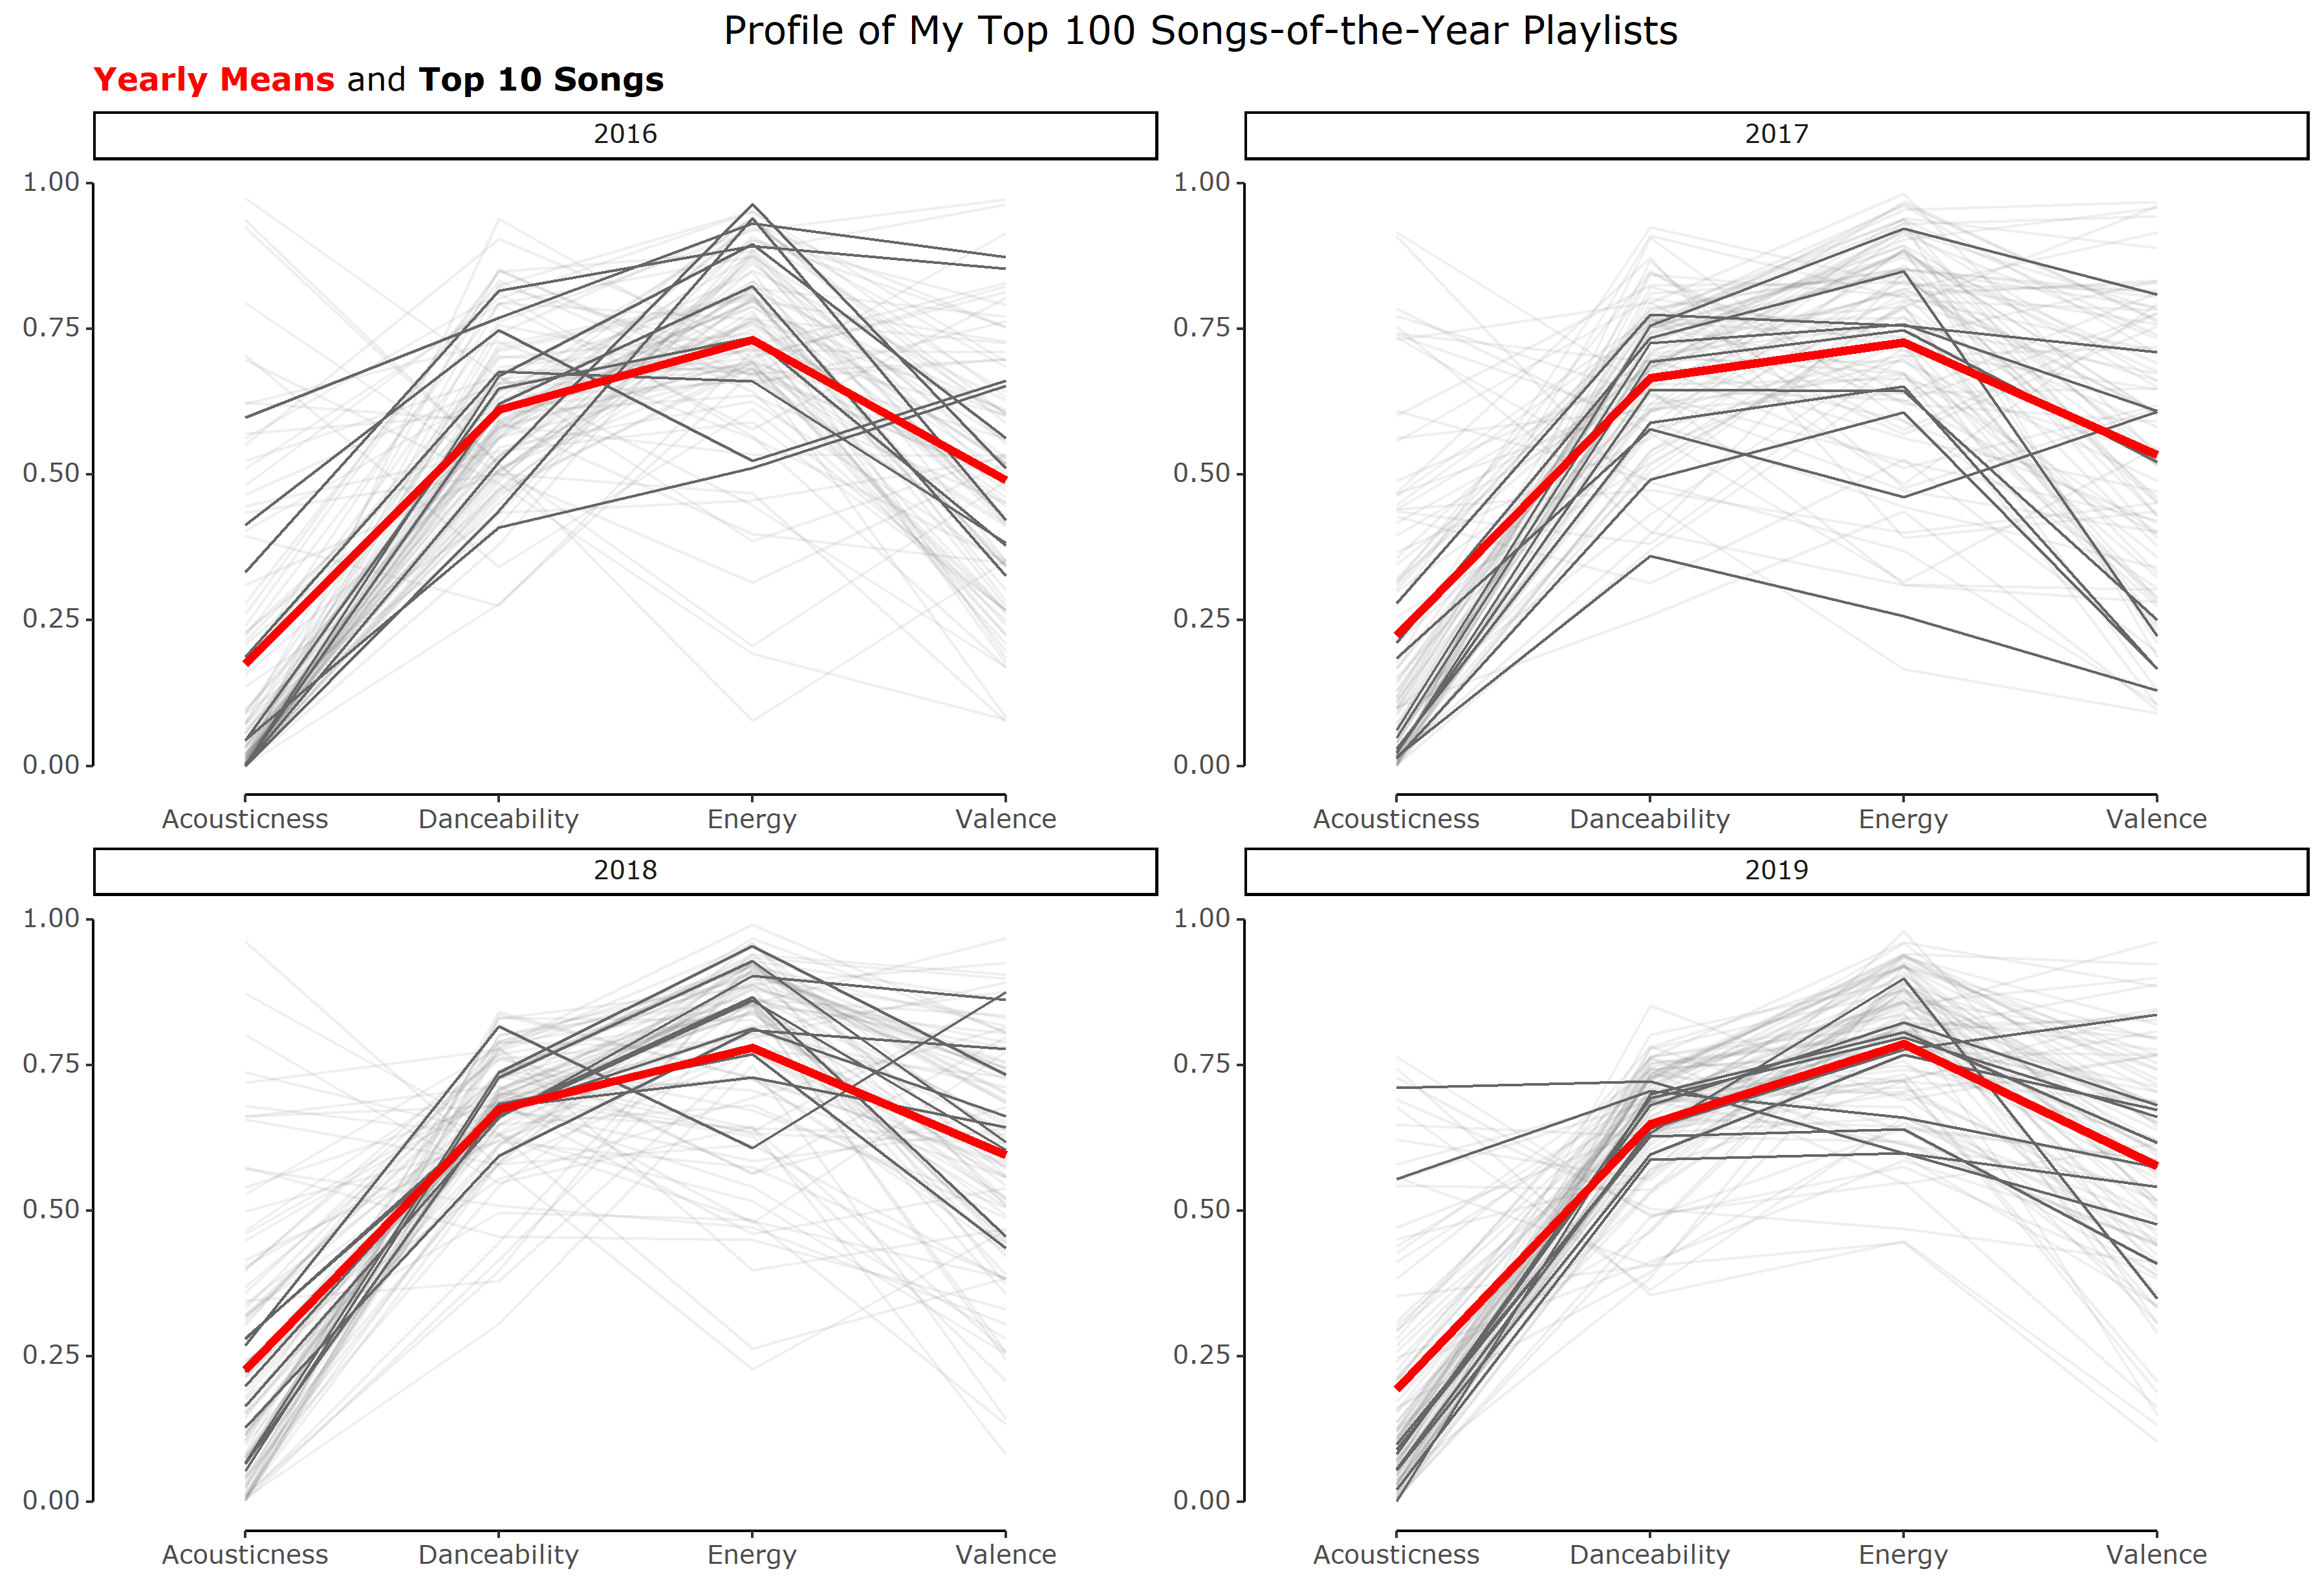
Six years of my Spotify playlists
An analysis of acoustic features with {spotifyr}

Shiny tips - the first set
%||%, imap() + {shinybusy}, and user inputs in modalDialog()
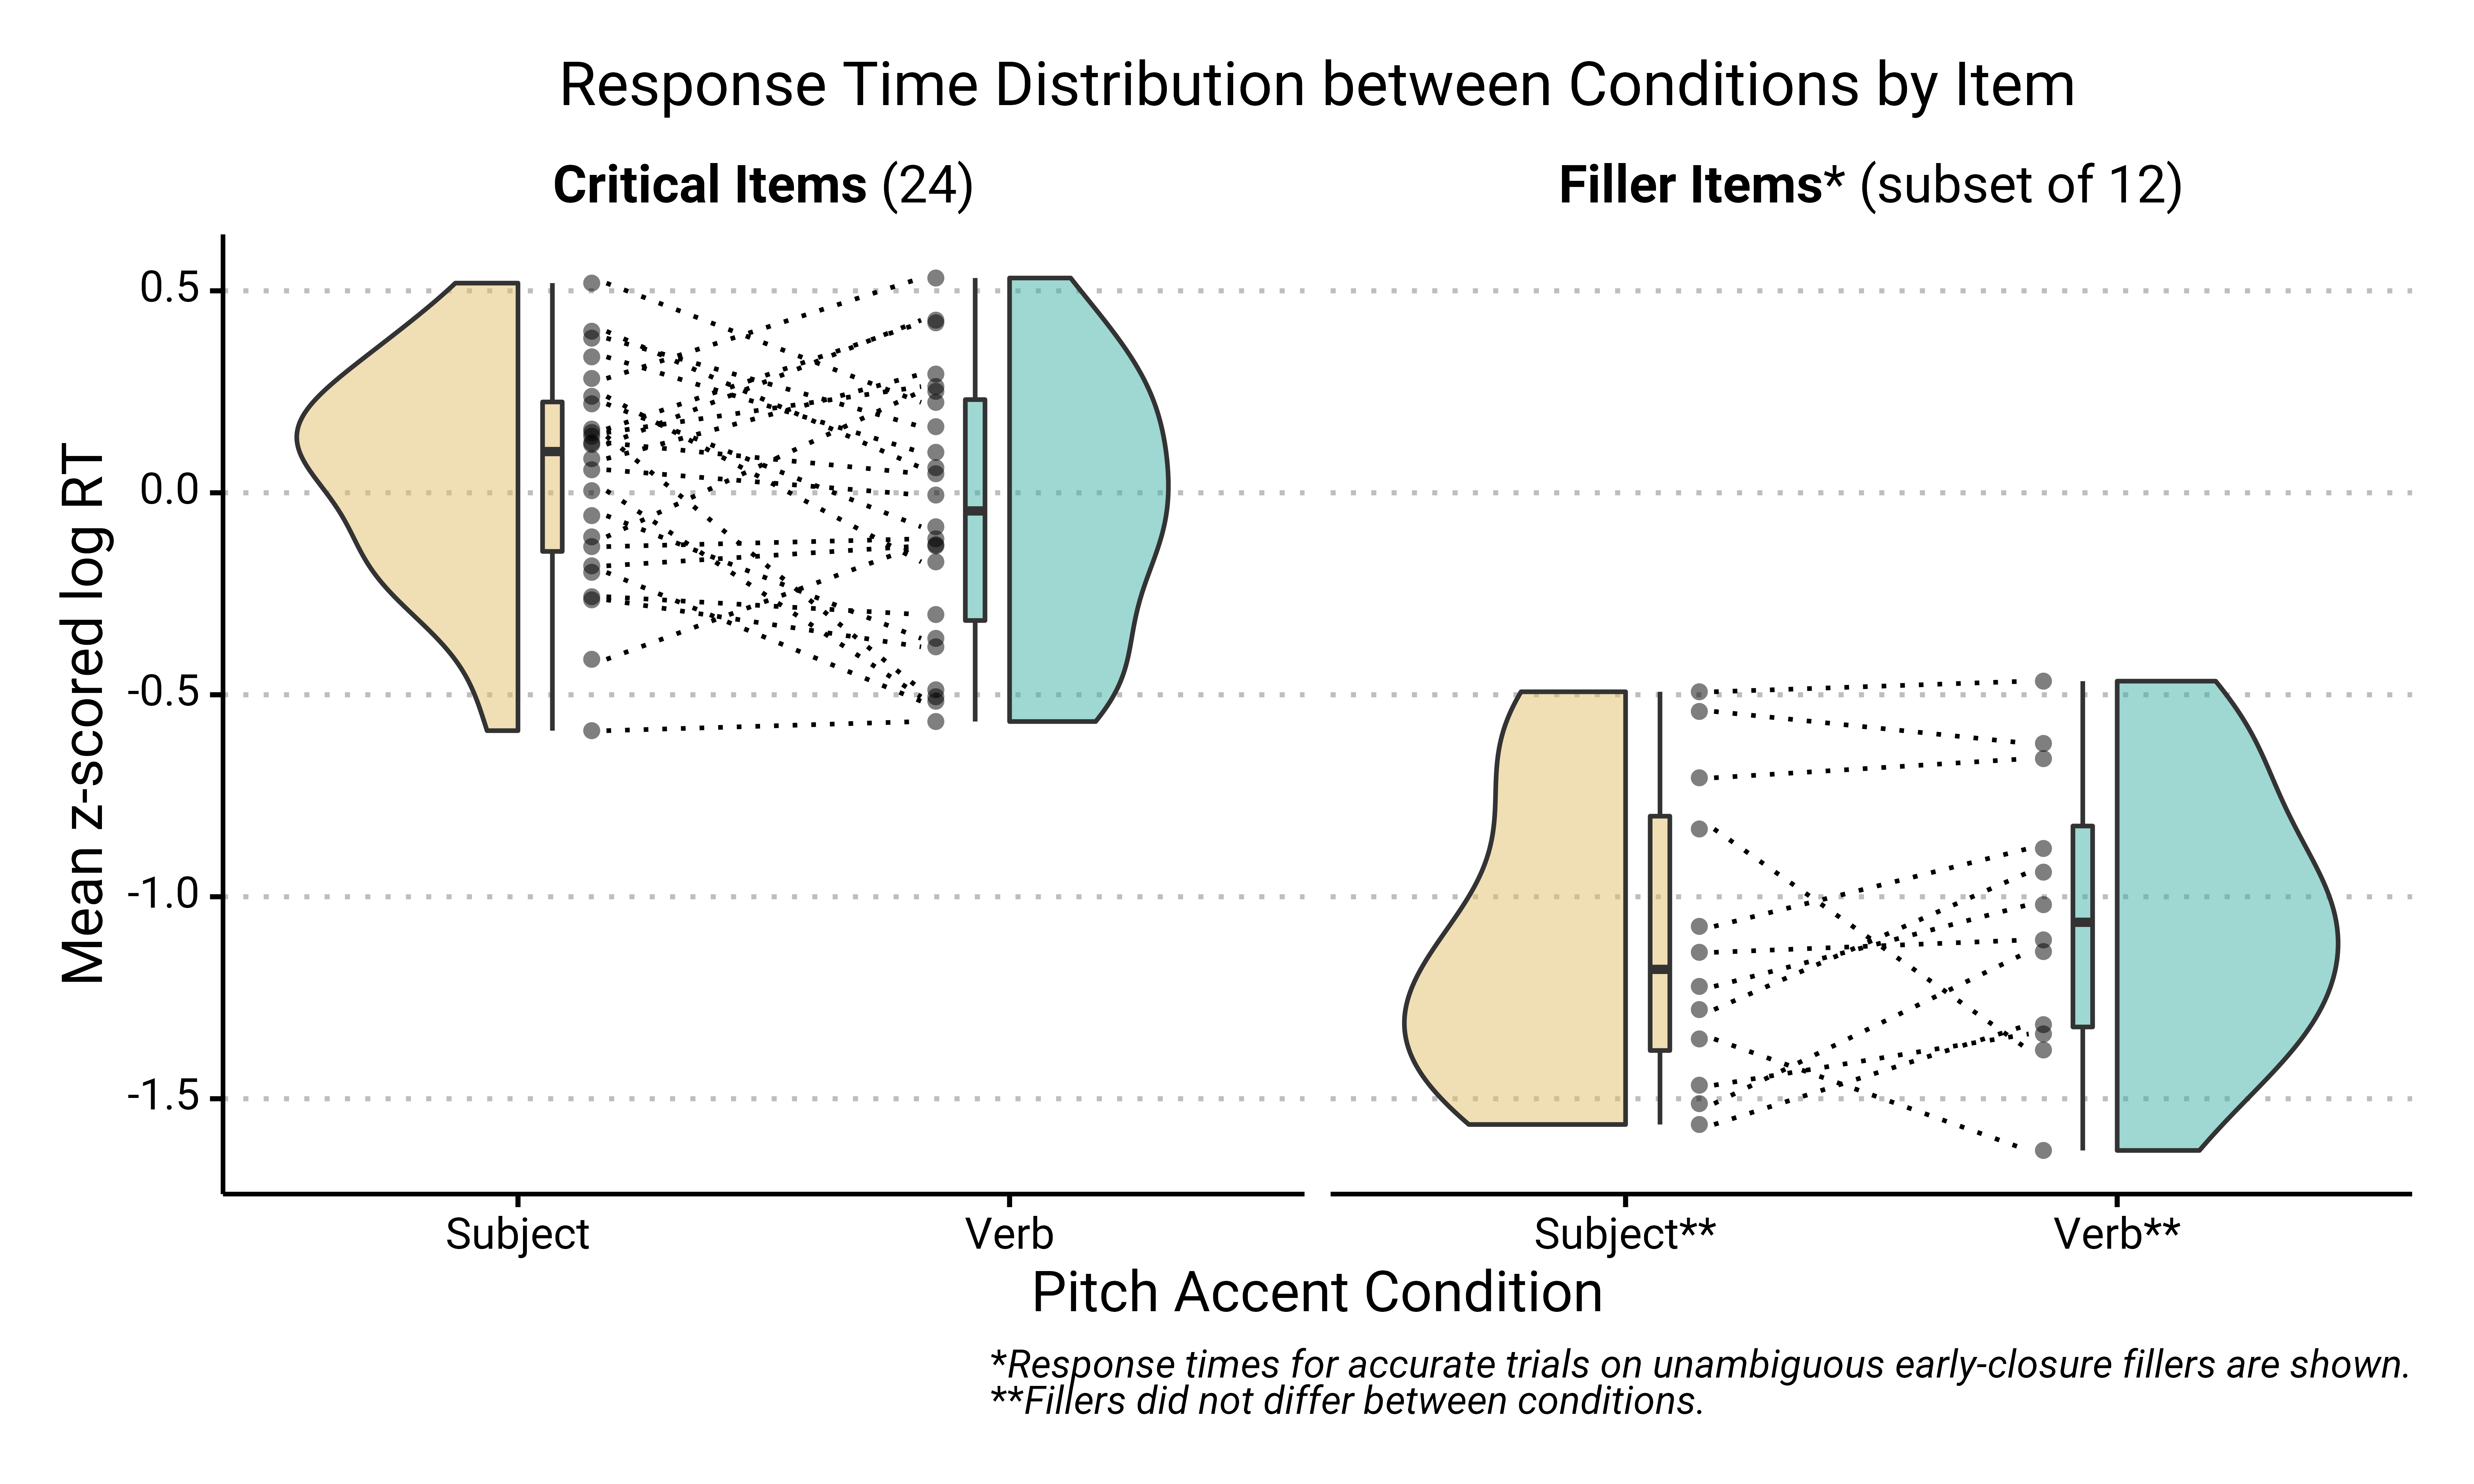
geom_paired_raincloud()
A {ggplot2} geom for visualizing change in distribution between two conditions.
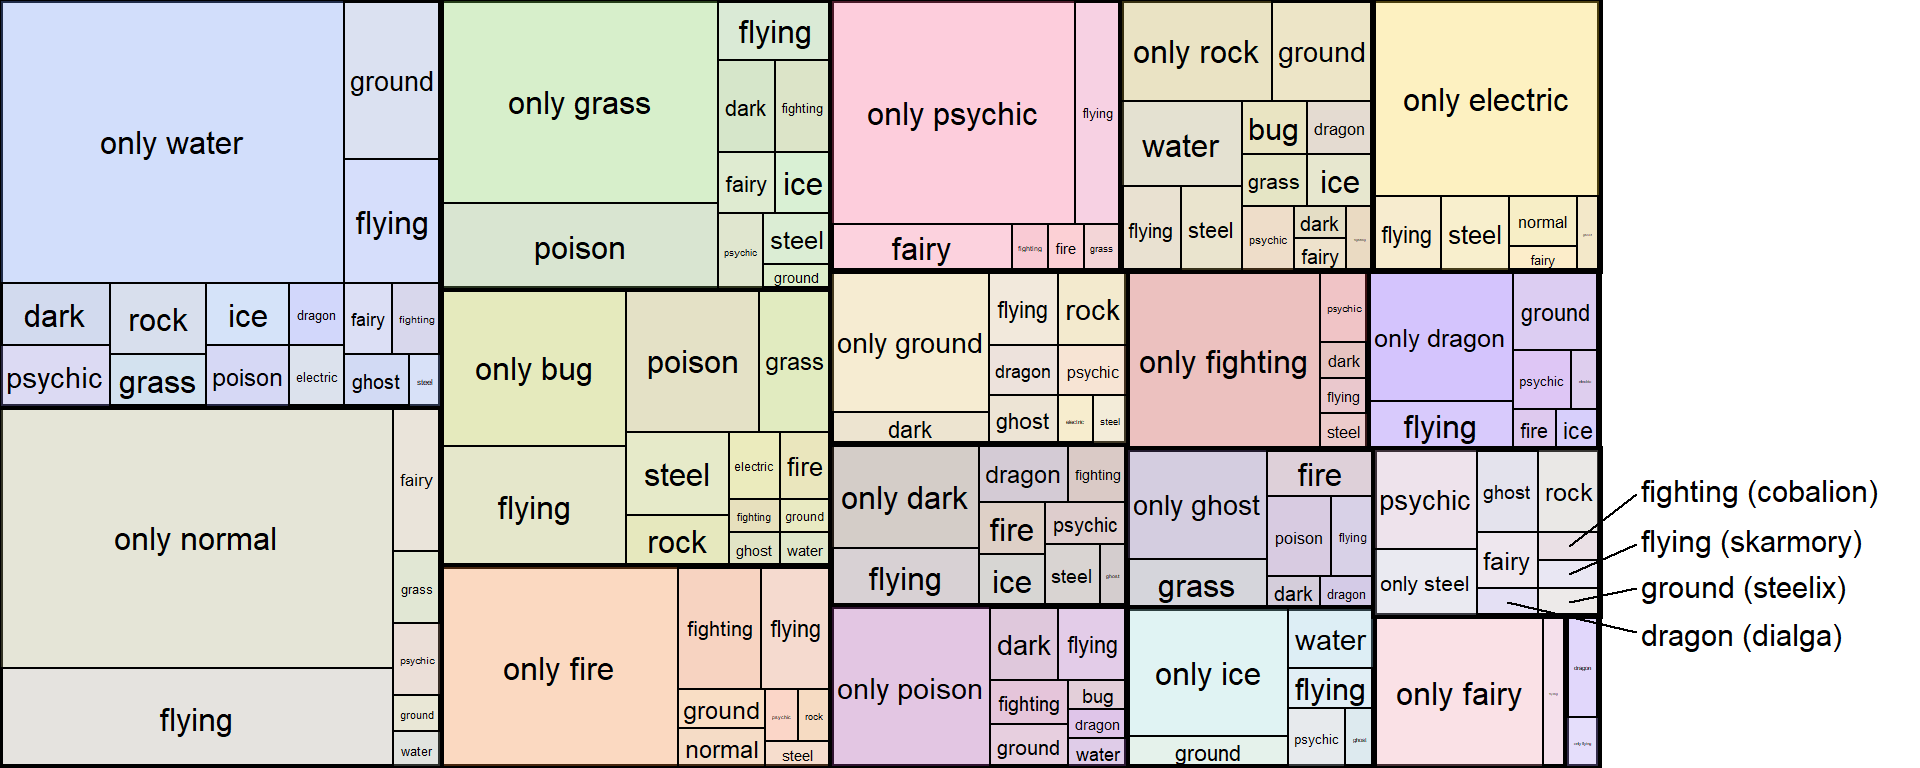
Plotting treemaps with {treemap} and {ggplot2}
Using underlying plot data for maximum customization

Indexing tip for {spacyr}
Speeding up the analysis of dependency relations.
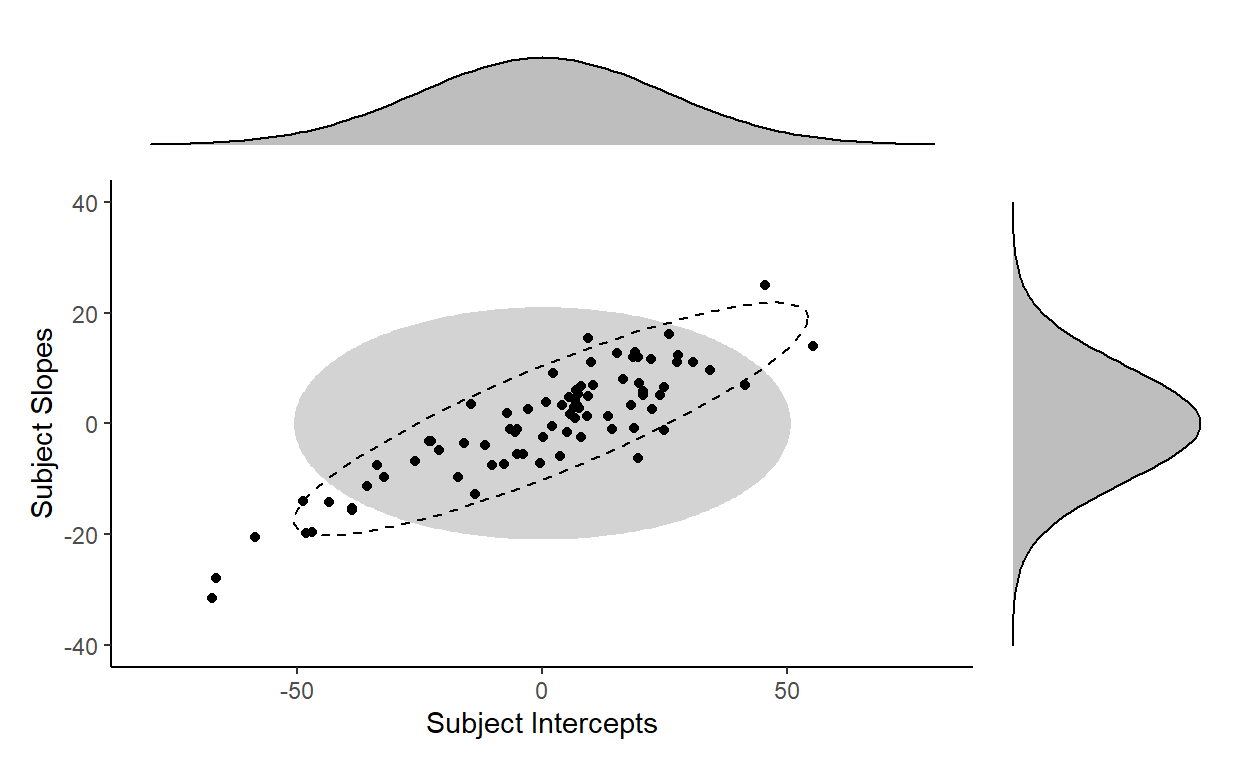
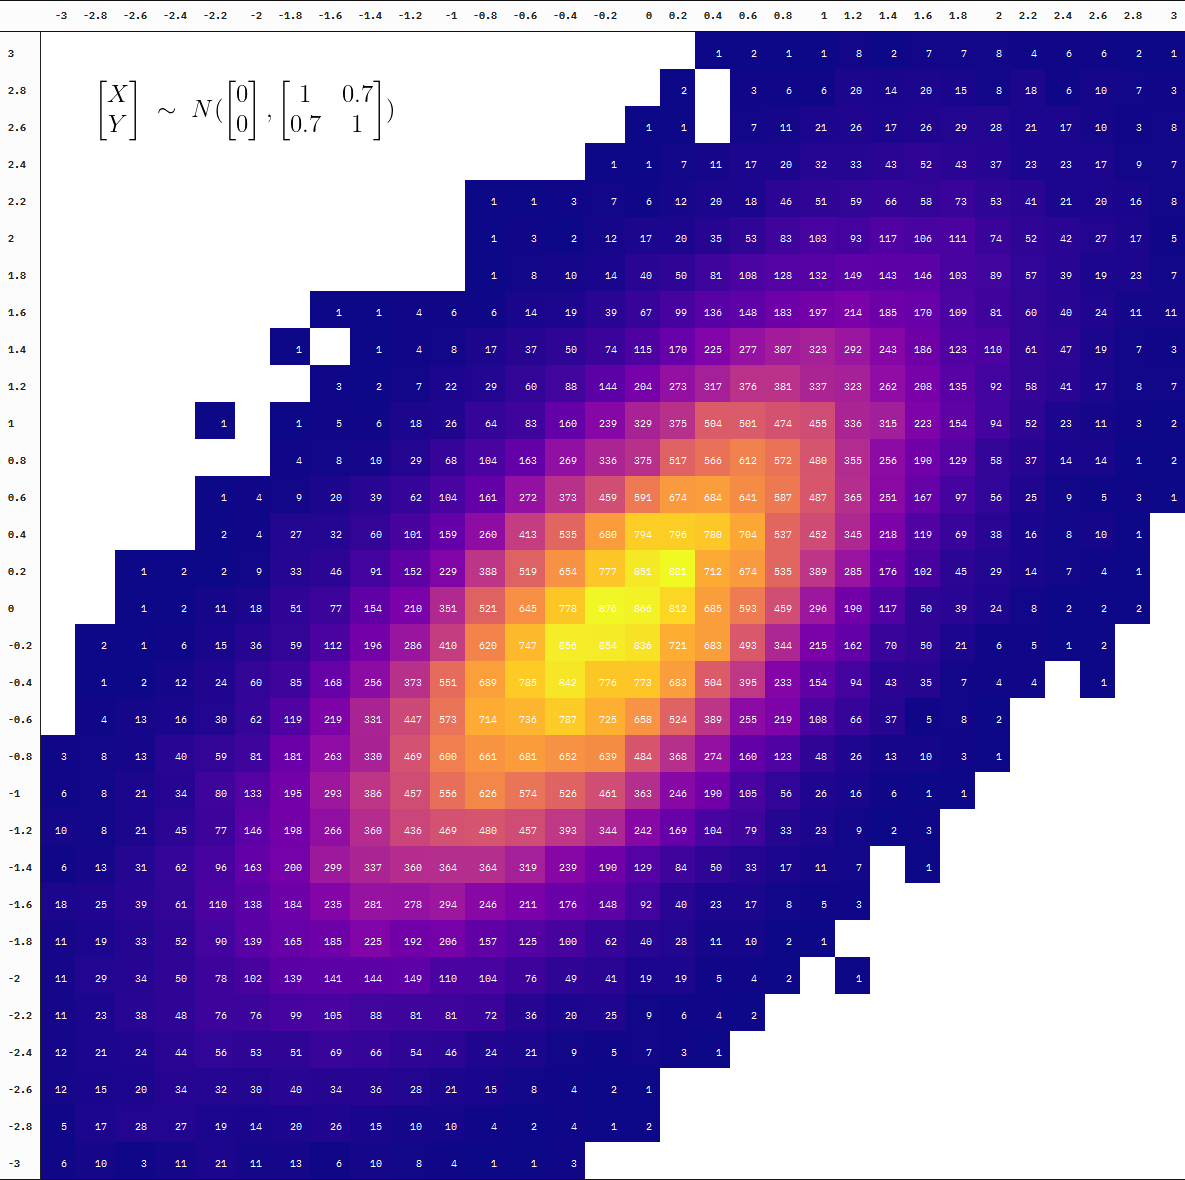
The Correlation Parameter in Mixed Effects Models
Notes on the Corr term in {lme4} output